The pressure on municipal Parks & Recreation departments to justify their budgets has never been more intense. As city councils face tightening fiscal constraints, the days of securing funding based on anecdotal evidence or rough estimates are rapidly fading. Traditional methods, like manual headcounts, often fall short of providing the objective, compelling data needed to advocate for essential maintenance, staffing, or expansion projects. The good news? A new era of smart park technology, powered by visual data, is transforming how departments demonstrate their indispensable value to the community, offering irrefutable proof to secure the funding they deserve.

The 'Headcount' Trap: Why Traditional Metrics Fall Short
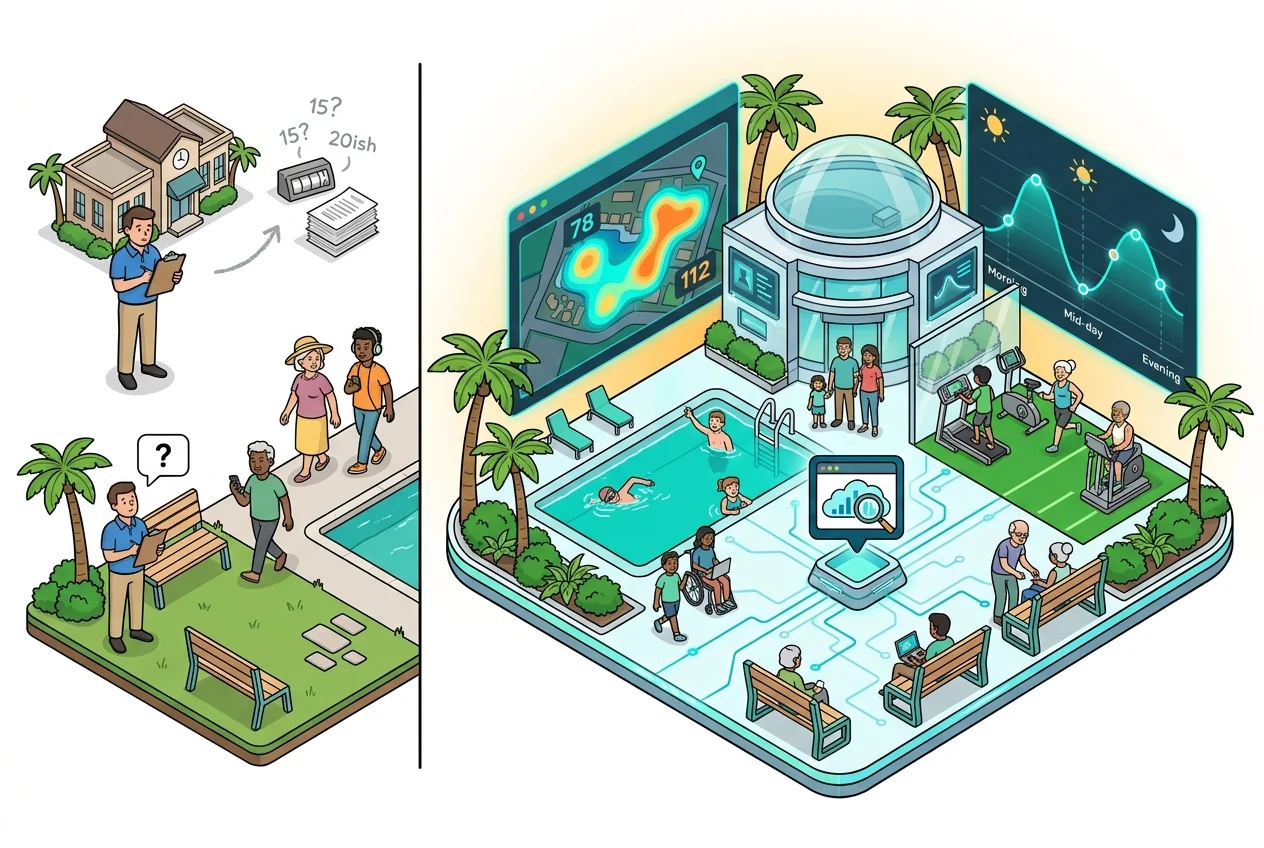
For decades, many Parks & Recreation departments have relied on manual headcounts or periodic surveys to gauge facility usage. While well-intentioned, these traditional metrics are fraught with limitations. Manual counts are inherently inaccurate, labor-intensive, and subjective, often influenced by the time of day, weather, or even the individual conducting the count. They offer a snapshot, not a comprehensive view, failing to capture the 'how' or 'when' of facility use.
This reliance on outdated methods often leads to the "empty park" perception. A city council member or budget committee might drive past a park during off-peak hours, observe few users, and conclude the facility is underutilized. What they don't see is the bustling activity during early mornings, evenings, or weekends. This superficial observation, unchecked by credible data, can lead to misinformed budget decisions, resulting in cuts to vital programs or the postponement of much-needed upgrades.
Did You Know?
A recent survey revealed that nearly 60% of municipal Parks & Recreation departments cite budget justification and funding as their biggest challenge, often due to a lack of objective data to present to city councils.
Without credible, objective data, it becomes incredibly difficult for directors to defend requests for increased maintenance budgets, additional staffing, or facility expansion. This often results in budget stagnation or even cuts, directly impacting the quality of public amenities and the community's access to vital recreational spaces. Moving beyond these outdated 'parks and rec budget justification' methods is no longer an option; it's a necessity for departmental survival and growth.
Visual Evidence: Beyond Presence to Proving Utilization
Enter visual data and smart park technology, a game-changer for proving amenity value. Amenivue's real-time camera views, coupled with AI-powered analytics, provide objective, undeniable proof of amenity usage. This isn't about security; it's about intelligent insights into how public spaces are truly being utilized.
Visual data goes far beyond mere presence counts. It reveals critical insights such as:
- Peak Usage Times: Identifying exactly when specific amenities are most active.
- Duration of Visits: Understanding how long users engage with different facilities.
- Specific Area Utilization: Pinpointing which sections of a park or equipment within a fitness center see the most action.
- User Intensity: Distinguishing between a single person casually using a court and a full basketball court with multiple games in progress, demonstrating actual demand.
Key Insights from Visual Data
- Real-time occupancy levels for pools, courts, and fitness centers
- Heatmaps showing popular zones within a facility
- Usage trends by day, week, or season
- Detection of specific equipment usage patterns
- Data to support fair access policies
This objective, irrefutable visual data provides context and depth that traditional methods simply cannot. When you can show a city council a time-series graph illustrating a pickleball court is at 90% capacity for 8 hours a day, or present a heatmap of a dog park showing consistent activity from dawn till dusk, your budget requests become significantly more compelling. This is the power of 'municipal facility usage data' and 'smart park technology' in action, transforming anecdotes into actionable intelligence.
Case Study: Data-Driven Upgrades and Expansions
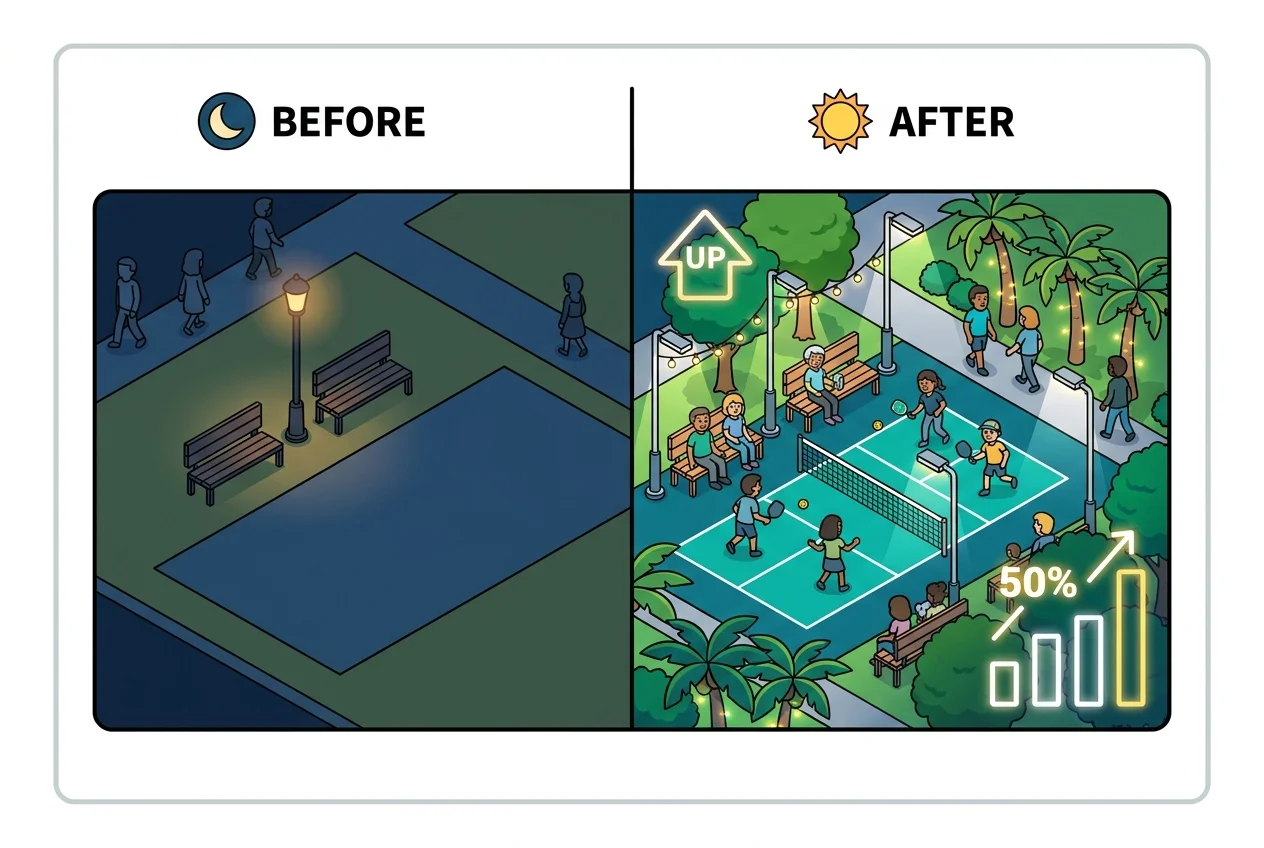
The practical applications of visual data for park planning metrics are vast and immediately impactful. Consider the common challenge of justifying lighting upgrades. Many amenities, like basketball courts or dog parks, might appear underutilized after sundown. However, visual data can reveal consistent heavy usage until dusk, followed by a sharp drop-off directly attributable to insufficient lighting.
Justifying Lighting Upgrades
By analyzing Amenivue's real-time feeds, a Parks & Recreation department might discover that a specific basketball court, currently dark by 7 PM, sees an average of 50 unique users between 5 PM and 7 PM on weekdays. This data can be presented to the City Council to justify an investment in modern, energy-efficient lighting, demonstrating how it would extend the court's usable hours by several hours each evening. The quantifiable ROI is clear: increased community engagement and utilization, potentially doubling the operational hours for a minimal investment. This approach proves the value of the investment by showing the potential for extended service and enhanced community benefit. Maximizing Sports Facility Revenue: The Unstaffed Late-Night League Opportunity with Remote Monitoring further illustrates this potential.
Proving Demand for New Facilities
Similarly, justifying new equipment or facility expansion becomes straightforward with consistent overcrowding data. If visual feeds repeatedly show a single pickleball court at 100% capacity during peak hours, with users waiting, this is undeniable proof of unmet demand. The data can quantify the average waiting time or the number of users turned away, building an ironclad case for adding a second court. This data-driven approach removes guesswork, ensuring that investments are made where the community truly needs them, thereby optimizing 'park planning metrics' and public funds.
Transparency, Trust, and Community Engagement
Beyond securing funding, integrating visual data into your operations fosters a new level of transparency and trust with both City Councils and the community. When departments present objective, verifiable data about how public funds are being used and how amenities are serving residents, it demonstrates responsible stewardship. This transparency builds credibility, making future requests for resources more likely to be met with understanding and support.
"Before Amenivue, our budget discussions were always a battle of opinions. Now, we walk in with hard data, and the conversation shifts from 'if' to 'how' we can best serve our community."
Furthermore, this data can be leveraged to build community trust directly. By sharing insights into amenity usage, Parks & Recreation departments can manage resident expectations, promote fair access during peak times, and justify new programs or policies based on actual usage patterns. For example, if data shows a particular playground is consistently overcrowded, it can inform a decision to expand or create an alternative play area. This proactive communication, driven by objective data, helps preempt concerns about underutilized facilities or justify necessary changes, positioning visual data as a core 'city council reporting tool' and a driver of enhanced accountability. For more on improving resident experience, see Beyond 'Is It Open?': Elevating Resident Amenity Experience with Real-Time Views.
From Anecdote to Asset: Professionalizing Your Annual Report
The annual report is a critical document for Parks & Recreation departments, and visual data elevates it from a mere formality to a powerful advocacy tool. Transitioning from qualitative observations and anecdotal evidence to quantitative, visual-rich reports professionalizes the entire presentation, making a far stronger case for continued and increased funding.
A data-driven annual report should include:
- Usage Heatmaps: Visually depicting areas of high and low activity within parks or facilities.
- Time-Series Graphs: Illustrating usage trends over hours, days, or seasons, highlighting peak periods and growth.
- Before/After Comparisons: Showcasing the impact of previous investments, such as increased usage after a facility upgrade.
- Key Performance Indicators (KPIs): Metrics like average daily visitors, peak occupancy rates, and amenity-specific utilization percentages, all derived from visual data.
Modern dashboards and automated reporting systems, like those offered by Amenivue, can compile and present this data clearly and professionally, reducing staff workload while enhancing report quality. This enables departments to quickly generate compelling visuals and insights for city council presentations. The power of a data-backed, visually compelling report is undeniable; it significantly increases the likelihood of securing future funding and solidifies the department's reputation as a forward-thinking, fiscally responsible entity. For further insights on data-driven accountability, consider Maximizing HOA Budgets: Visual Verification for Smarter Vendor Accountability.

Frequently Asked Questions
### How does visual data differ from traditional park usage surveys?
Visual data, captured through real-time cameras and AI analytics, provides continuous, objective, and granular insights into amenity usage. Unlike periodic surveys or manual headcounts, it captures precise timing, duration, and intensity of use across various facilities, offering a far more accurate and comprehensive picture of utilization patterns.
### Is this technology privacy-compliant?
Yes, reputable smart park technology, like Amenivue, is designed with privacy in mind. It focuses on aggregate usage data and patterns rather than individual identification. The cameras are typically positioned to monitor general activity levels within amenity spaces, not to identify specific individuals, ensuring compliance with privacy regulations.
### Can visual data help justify staffing needs?
Absolutely. By demonstrating peak usage times and high demand for certain amenities, visual data can provide clear evidence for the need for additional staff, whether for maintenance, supervision, or program delivery. It can show where and when staff presence would have the greatest impact on user experience and safety.
### How quickly can we see results from implementing visual data solutions?
The benefits of visual data can be realized almost immediately. Once cameras are installed and the system is operational, real-time data begins flowing in. Within weeks, departments can start identifying peak usage times, popular amenities, and areas of high demand, providing actionable insights for budget justifications and operational adjustments.
### What kind of return on investment (ROI) can we expect?
The ROI can be significant, ranging from securing previously denied funding for critical upgrades and expansions to optimizing operational efficiency. By justifying investments with hard data, departments can avoid wasted spending on underutilized projects and direct resources to areas of proven community need, leading to better community satisfaction and long-term financial stability.
### Is this technology difficult to integrate with existing city systems?
Most modern visual data platforms are designed for straightforward integration. Amenivue, for example, offers user-friendly dashboards and reporting tools that can complement existing municipal reporting systems, providing easily digestible data without requiring complex IT overhauls.
Transform Your Budget Justification with Amenivue
The era of guesswork in municipal park management is over. Embracing data-driven decision-making through visual technology is the key to not only securing the funding your Parks & Recreation department deserves but also to building a stronger, more engaged community. By shifting from outdated metrics to objective, compelling visual evidence, you can lead your department into a future of better funding outcomes, improved community services, and an enhanced reputation as a forward-thinking leader.
Ready to transform your budget justification strategy and ensure your community's parks and recreation facilities thrive? See our platform in action and discover how Amenivue can empower your department with the visual data it needs to succeed.