
Usage Analytics & Insights
Understand how your community uses amenities with aggregate analytics. Track adoption, identify peak hours, and make data-driven decisions — all without tracking individual residents.

Know how your community engages
Track active users across different time windows to understand engagement patterns and measure the value you're providing to residents.
Daily Active Users
Residents who viewed amenity cameras today
Immediate engagement indicator
Weekly Active Users
Unique viewers in the last 7 days
Regular engagement patterns
Monthly Active Users
Unique viewers in the last 30 days
Overall adoption health
Feature Usage
Map opens, history views, camera switches
What residents actually use
Spot patterns over time
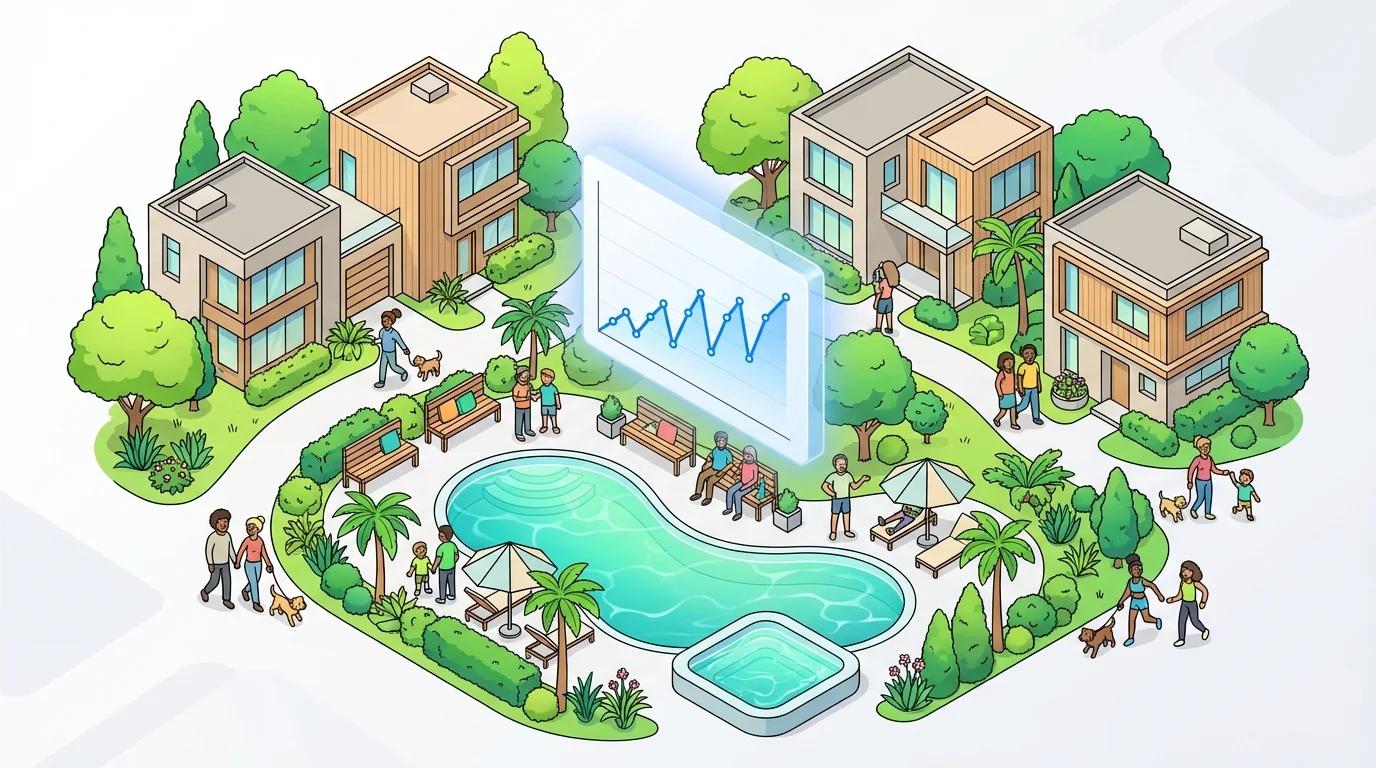
Compare usage across different time windows to understand how engagement changes. See weekly cycles, seasonal patterns, and long-term trends.
- 7-day view for weekly patterns
- 30-day view for monthly trends
- 60 and 90-day views for seasonal analysis
- Compare current vs. previous periods

Know when amenities are busiest
Heatmap visualization shows exactly when residents are checking cameras most frequently. Help residents plan pool visits, gym sessions, and common area use.
Identify rush hours
Weekend vs. weekday patterns
Understand what matters most
See which cameras get the most attention. Identify which amenities residents care about and ensure your most popular views are always reliable.
Top Cameras
Ranked list of most-viewed cameras. Know which amenities get the most attention from residents.
View Distribution
Percentage breakdown across all cameras. See if views are concentrated or spread evenly.
Reliability Metrics
Camera uptime and connection health. Ensure your most popular cameras are always available.
Track the resident journey
See how residents move from invitation to active usage. Identify where drop-off happens and take action to improve adoption.
Track how many residents have registered trusted devices for faster login.


Insights without intrusion
All analytics are aggregate-only. We never track which specific residents view which cameras or when. You get the insights you need without compromising anyone's privacy.
- No individual viewing behavior tracked
- All metrics are aggregated and anonymized
- No personal data collected or stored
- Compliant with privacy best practices
- Residents can use the system worry-free
Export your reports
Download analytics reports for board meetings, planning sessions, or record-keeping. Available in CSV and PDF formats.
Explore related features
See analytics in action
Request a demo to see how analytics can help your community make better decisions.
Request a Demo