The landscape of Parks, Recreation, Open Space, and Trails (PROST) planning is undergoing a profound transformation. As we move into 2026 and beyond, industry insights reveal a critical shift: data-driven decision-making and sustainability are no longer aspirational goals but non-negotiable requirements for municipal master plans. The era of relying solely on anecdotal evidence, resident complaints, or infrequent surveys to justify significant capital improvements is rapidly fading. Today's city councils and taxpayers demand objective, verifiable evidence for every dollar spent. This article will explore why traditional planning methods fall short, how visual analytics and real-time amenity viewing provide the indisputable utilization data necessary for robust master plans, and how this technology empowers Parks & Recreation Directors and City Planners to make smarter, more accountable, and community-aligned investment decisions.
Beyond Anecdote: Why Traditional Planning Methods Fall Short
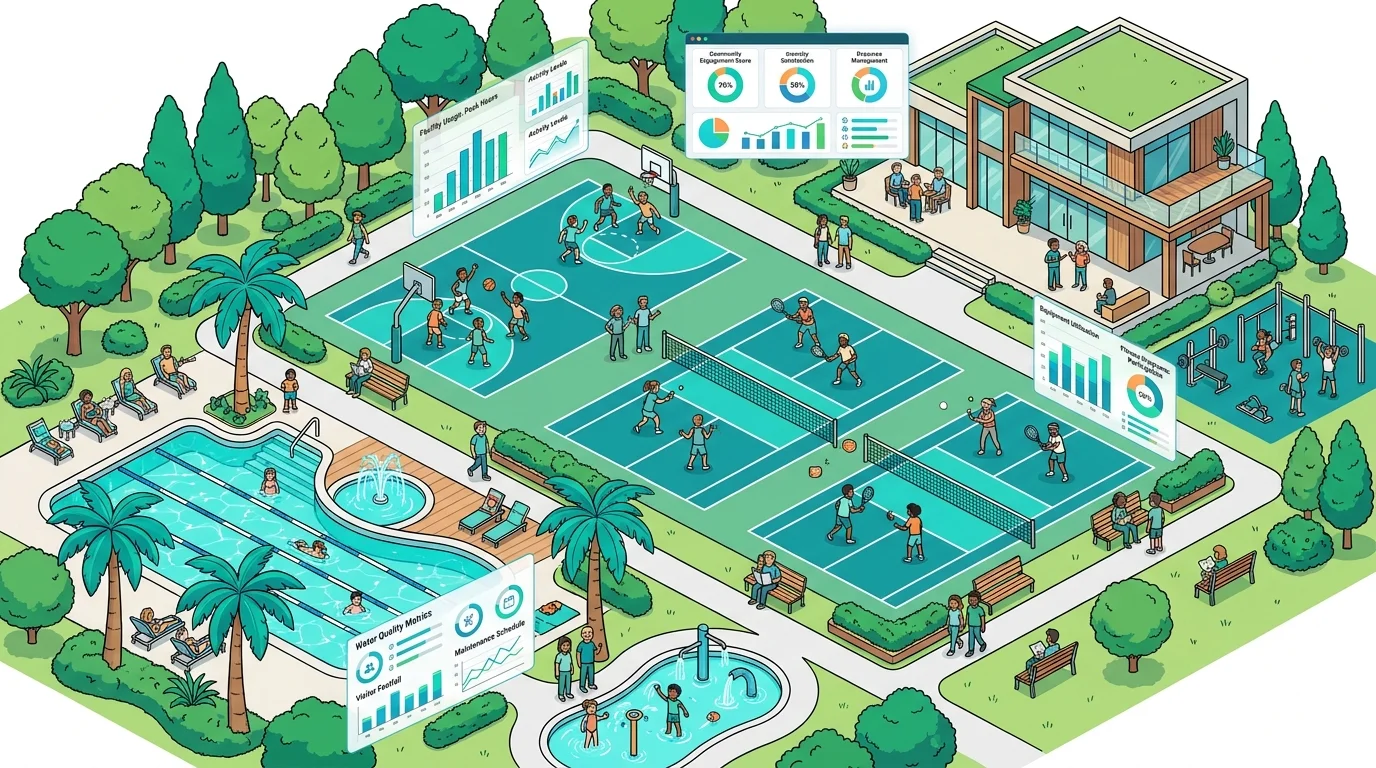
For decades, parks and recreation planning often relied heavily on intuition, direct feedback (sometimes complaints) from vocal residents, and intermittent, manual observations. While these methods provided a human touchpoint, they inherently lacked the comprehensive, objective data needed for strategic, long-term planning. The limitations of static data sources – such as surveys conducted years ago, one-off community meetings, or labor-intensive manual headcounts – are increasingly apparent. These snapshots fail to capture the dynamic usage patterns, peak demand fluctuations, and true utilization rates that define a vibrant community amenity.
Planning based on assumptions, rather than concrete evidence, can lead to significant financial and community impacts, including wasted investments in underutilized facilities or critical unmet needs in popular areas.
Without robust data, municipalities risk misallocating resources, investing in projects with low ROI, or overlooking genuine community needs. Imagine justifying a multi-million dollar pickleball court expansion based on a handful of resident requests, only to find the existing courts rarely reach full capacity during peak hours. This approach is no longer viable. The "2026 mandate" for sustainability and data-driven accountability in municipal projects emphasizes the need for verifiable evidence to ensure taxpayer dollars are spent wisely and effectively. Studies show that projects backed by comprehensive data are 2.5 times more likely to secure funding and achieve their intended community impact.

The Power of Visual Analytics: Real-Time Utilization Data
Visual analytics, in the context of parks and recreation, refers to the continuous, objective monitoring of amenity usage through live camera feeds. This technology offers an unprecedented level of insight into how residents truly interact with public spaces. Unlike traditional surveys, which can be subject to recall bias or self-reporting inaccuracies, or manual headcounts that are labor-intensive and provide only intermittent data, visual analytics offers a consistent, unbiased stream of information.
Did You Know?
Real-time amenity viewing platforms provide continuous data streams, capturing usage patterns 24/7. This allows planners to identify micro-trends and utilization nuances that traditional methods simply cannot detect, such as specific hours of peak demand or underutilized periods for various amenities.
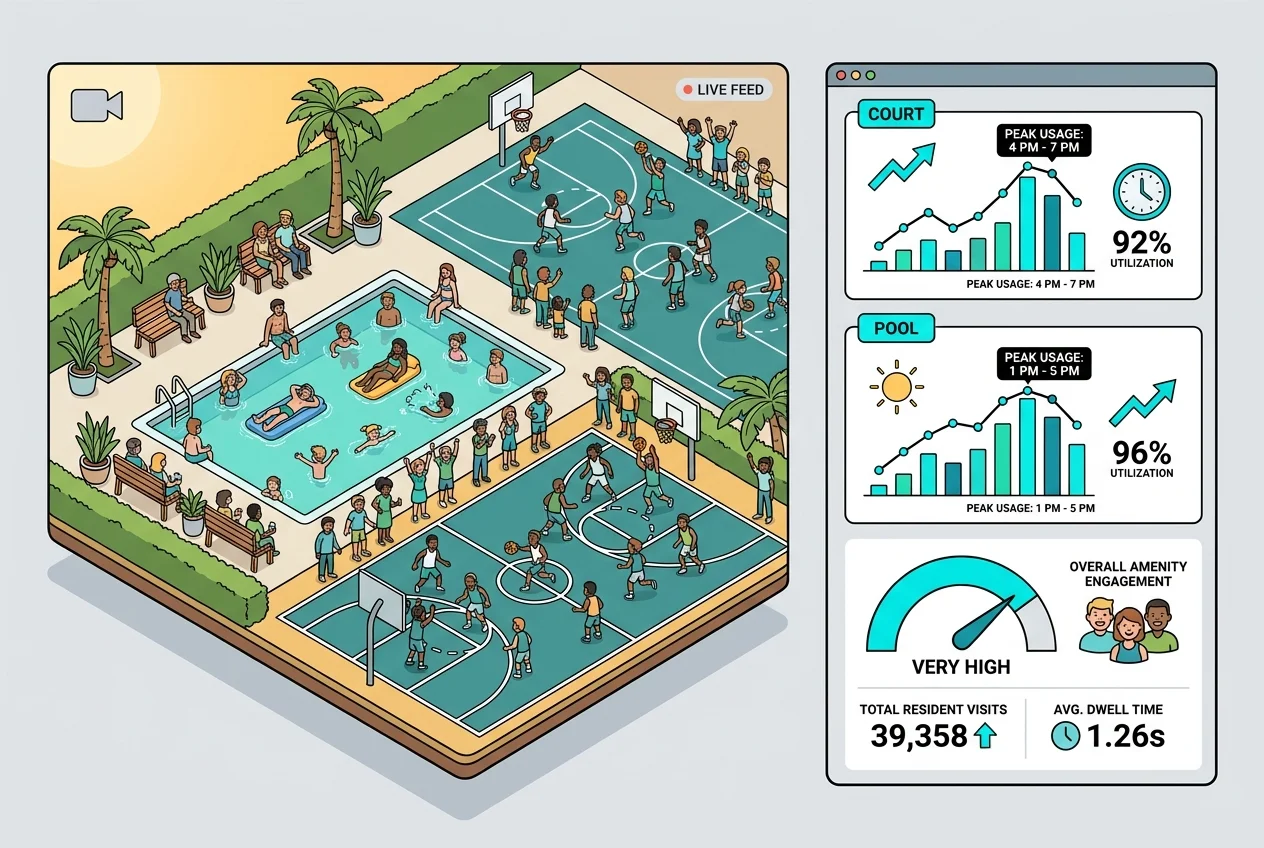
The core strength of this approach lies in its ability to provide indisputable evidence. Live feeds offer visual proof of demand, allowing planners to observe peak times, identify bottlenecks, and even infer user demographics (e.g., families, seniors, youth) without identifying individuals. This depth of insight is invaluable for understanding how amenities are truly being used. For instance, you might discover that a basketball court is consistently overcrowded between 4 PM and 7 PM on weekdays, while a nearby tennis court remains largely empty. This kind of objective data is crucial for understanding service gaps and optimizing resource allocation. For further insights into managing facility traffic, read our optimize gym traffic guide.
Justifying Capital Improvements with Unquestionable Data
When presenting a case for capital expenditures to city councils, indisputable data is your most powerful ally. Visual utilization data translates directly into a compelling narrative for investment. Imagine demonstrating, with real-time video clips and corresponding data dashboards, that your community's single swimming pool reaches 150% capacity every afternoon during the summer, leading to long wait times and resident dissatisfaction. This objective evidence makes a far stronger case for a pool expansion or the construction of a new aquatic facility than anecdotal complaints ever could.
Examples abound:
- Overcrowded Courts: Consistent visual evidence of a basketball court at maximum capacity, with residents waiting off-court, provides clear justification for adding more courts or converting an underused space. Our maximize bookings article shares more on this.
- Fitness Center Upgrades: Data showing high usage of specific cardio equipment or free weights can justify equipment upgrades or expanding the fitness center footprint, aligning with actual community demand.
- Park Improvements: If data reveals a particular playground area is consistently busy while another sits empty, it can justify investing in new, more engaging equipment for the popular area or redeveloping the underutilized one.
By quantifying demand and presenting ROI projections based on actual usage patterns – not just assumptions – Parks & Recreation Directors can show how investments will directly address community needs and enhance resident satisfaction. With an average of 30% increased project ROI reported by municipalities leveraging data-driven planning, the financial benefits are clear. This approach ensures taxpayer dollars are spent on facilities that will be actively used, appreciated, and contribute to the community's well-being for years to come.
Optimizing Existing Assets: Repurposing and Strategic Redevelopment
Beyond justifying new construction, visual analytics is equally powerful in optimizing existing infrastructure. It helps identify truly underutilized facilities – not just those perceived as empty – allowing for strategic repurposing and redevelopment. This is a cornerstone of sustainable planning, maximizing the lifespan and utility of every asset.
Benefits of Data-Driven Asset Optimization
- Identifies truly underutilized spaces
- Supports sustainable repurposing decisions
- Maximizes existing infrastructure's value
- Reduces need for new construction
- Ensures efficient resource allocation
Consider a scenario where a city has several aging tennis courts. Visual analytics might reveal that one particular court is used less than 10% of the time, while the burgeoning popularity of pickleball means residents are clamoring for more courts. Data could justify converting that underused tennis court into two or three new pickleball courts, addressing a clear community need without building entirely new facilities. Similarly, if a picnic area consistently shows low usage, data might suggest adding shade structures, grilling stations, or even converting it into a community garden to attract more visitors. For ideas on managing park visitors, check out our manage overcrowding article.
Optimizing existing infrastructure before embarking on new construction offers significant environmental and financial benefits. It reduces construction waste, lowers capital outlay, and ensures that every square foot of public space is serving its community effectively. This data-backed approach supports sustainable planning by ensuring efficient allocation of resources and maximizing the lifespan of assets, making parks and recreation services more resilient and responsive.
Building Trust and Transparency: A Community-Centric Master Plan
Integrating data-driven decision-making into parks and recreation master planning inherently fosters greater transparency and trust with residents and stakeholders. When decisions are backed by objective, verifiable visual evidence, the rationale behind master plan choices becomes undeniable. This clarity can significantly reduce pushback, manage expectations, and increase overall community buy-in for projects.
"Before visual analytics, our master plan discussions often devolved into debates based on personal opinions. Now, with irrefutable data, we can show residents exactly why we're making certain investments, building a level of trust and collaboration we've never had before."
Residents can see, through data dashboards and summary reports, the actual usage patterns that inform decisions, such as why a particular park is receiving new funding for upgrades, or why a specific amenity is being repurposed. This open communication builds confidence that their tax dollars are being invested wisely and thoughtfully. Moreover, continuous data collection enables the creation of dynamic, adaptable master plans that can respond to evolving community needs. If new trends emerge or demographic shifts occur, visual analytics provides the early warning signs, allowing planners to adjust strategies proactively rather than reactively. This proactive approach leads to future-proofing parks and recreation services, ensuring smarter, more accountable, and truly community-aligned investments that serve generations to come. For more on how data can transform community engagement, explore our insights on how enhance resident apps.

Conclusion: The Future of Parks & Recreation is Data-Driven
The integration of visual analytics into parks and recreation master planning represents a pivotal shift towards more effective, equitable, and sustainable community development. By moving beyond subjective decision-making to objective, evidence-based strategies, municipalities can ensure that every investment in their PROST infrastructure is purposeful and impactful. This approach not only optimizes resource allocation and ensures long-term sustainability but also significantly enhances community satisfaction and builds public trust. For Parks & Recreation Directors and City Planners, embracing modern visual analytics solutions is not just an upgrade; it's essential for creating resilient, beloved public spaces that truly serve their communities.
Frequently Asked Questions
What is a Parks & Recreation Master Plan?
A Parks & Recreation Master Plan is a strategic document that guides the development, management, and programming of a community's parks, facilities, and open spaces over a specific period, typically 5-10 years. It outlines goals, objectives, and implementation strategies based on community needs and available resources.
Why is data-driven planning becoming critical for PROST?
Traditional planning methods often rely on anecdotal evidence or infrequent surveys, which can lead to misallocated funds and unmet community needs. Data-driven planning, especially with real-time utilization data, provides objective evidence to justify investments, optimize existing assets, and ensure projects align with actual community demand, meeting the growing demand for accountability and transparency.
How does visual analytics provide "indisputable evidence"?
Visual analytics uses live camera feeds to continuously monitor amenity usage. This provides objective, observable data on peak times, traffic flow, and utilization rates, offering visual proof that is difficult to dispute. It eliminates the biases and inaccuracies often associated with self-reported surveys or intermittent manual counts.
Maximizing Data Impact
To maximize the impact of your visual analytics data, integrate it directly into your reporting dashboards and presentations for city council. Visualizing trends, peak usage, and underutilization with clear graphs and supporting video snippets makes your case for capital improvements much stronger and more compelling.
Can visual analytics identify individuals using amenities?
No, the primary purpose of visual analytics for amenity viewing is to gather aggregate utilization data, not to identify individuals. The technology focuses on traffic patterns, occupancy rates, and overall usage trends to inform planning decisions, ensuring privacy while providing valuable insights.
How can data help optimize existing park assets?
By identifying truly underutilized facilities through continuous monitoring, data allows for strategic repurposing or redevelopment. For example, an underused tennis court could be converted into pickleball courts or a community garden based on evidenced demand, maximizing the utility of existing infrastructure and minimizing the need for new construction.
Ready to transform your parks and recreation master planning with objective, verifiable data? Discover how Amenivue’s visual analytics platform can provide the insights you need to justify capital improvements, optimize assets, and build community trust. Schedule a personalized demo today to see it in action.